Explore a territory.
Use county property information and geographic filters to focus research on the homes and municipalities relevant to your services.
 IntelligenceShow us your workflow
Chimney Atlas · Home services
Bring property information, market potential and prospecting decisions into one workspace. See where your offer fits and which records deserve a closer look.
The public demonstration below uses synthetic records. It does not expose client contacts or run live campaigns.
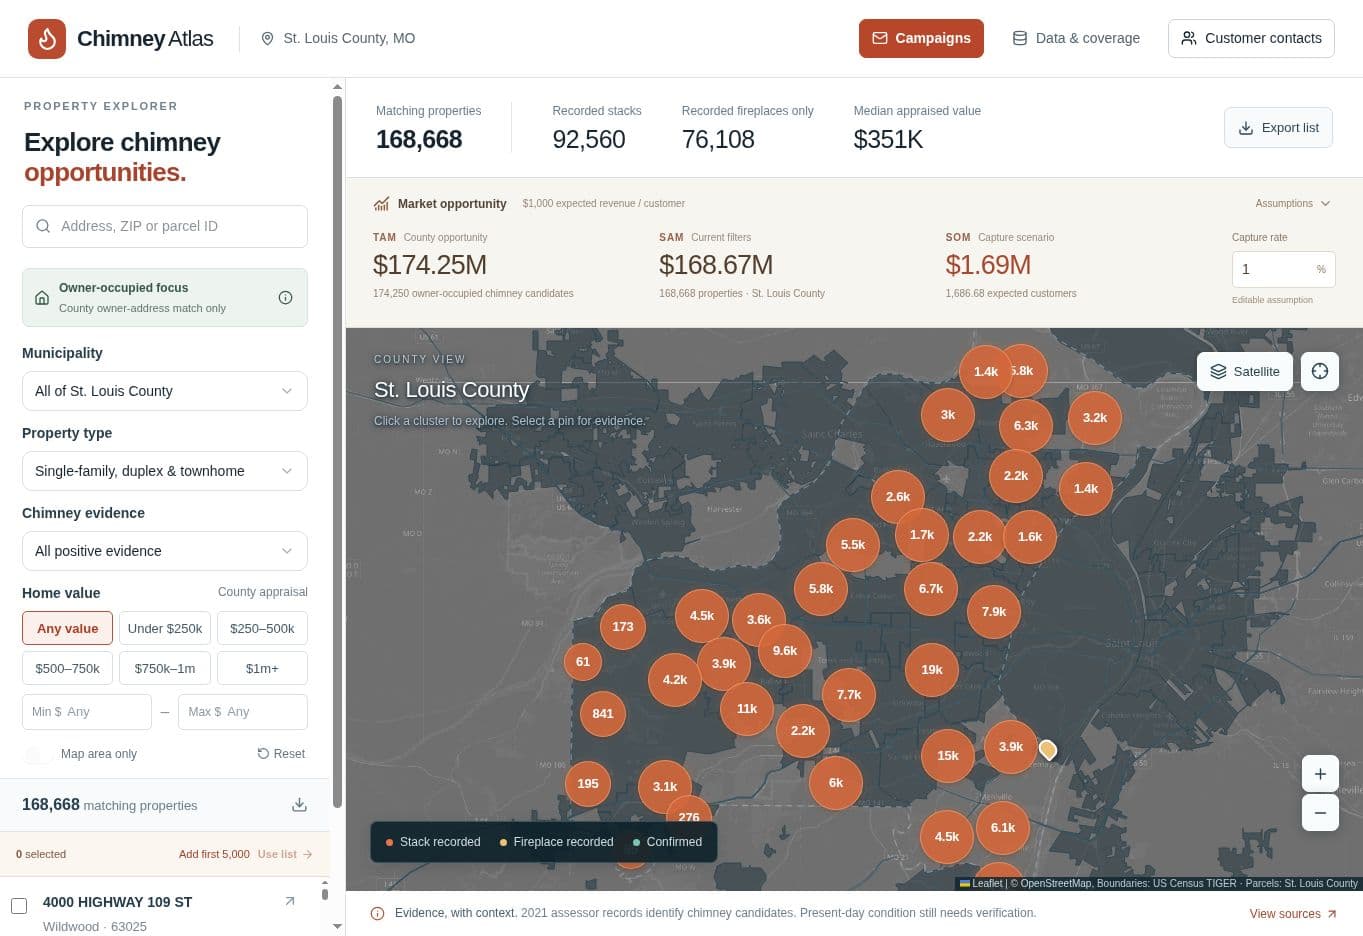
Actual application interface. The interactive demonstration below is a separate, illustrative experience.
The business problem
A service business needs to know which properties fit, how much territory it can serve and what to do next. Atlas brings those questions together around property records and an explicit set of assumptions.
Use county property information and geographic filters to focus research on the homes and municipalities relevant to your services.
Compare total market potential, serviceable properties and a realistic capacity limit. Change the inputs to see what actually drives the model.
For your implementation, we can connect selected records to enrichment and approved CRM campaign actions. We scope those integrations and access with your team; they are not connected to this public demo.
Try it · No signup required
Change the territory and construction era, inspect a sample property, then adjust the service assumptions. Watch how the size of the opportunity and your operating capacity interact.
Explore a territory. Understand the opportunity.
9 synthetic example records · no real contacts
10,500 hypothetical homes × $1,000 modeled annual spend
6,300 assumed eligible homes after territory and era filters
126 target customers · 2% capture, capped at 150/year
Illustrative layout, not surveyed municipal boundaries. Select a sample record to highlight it. All records and market counts are synthetic.
Model: one service per customer over 12 months, plus an assumed repair incidence during the same period. Expected revenue per customer = service price + repair rate × repair ticket. At the defaults: $250 + 15% × $5,000 = $1,000. SOM is the lower of SAM homes × capture rate or annual customer capacity, rounded down to whole customers.
Sample market inputs: Kirkwood: 4,800 total / 3,200 eligible homes; Ladue: 2,100 / 1,200; Webster Groves: 3,600 / 1,900. These are invented planning inputs, not county counts. Era filtering changes SAM; geography changes TAM and SAM. Eligible does not mean a verified chimney or a customer needing service.
This is a gross revenue planning scenario, not verified demand, a forecast or profit. Costs, competition, service frequency and conversion still need validation. No enrichment, contact export or campaign sending is connected to this public demonstration.
The next layer of intelligence
For your business, a custom system could combine verified property changes, applicable permit activity, public requests for help or first-party service history. The goal is to find a relevant need earlier and give your team a clear, evidence-backed next step.
These are potential extensions, scoped around available and permitted sources. A property characteristic alone does not establish a maintenance problem or buying intent.
Built for the way your company grows
Bring your service area, your ideal customer and the tools your team uses today.